1 Getting started with Remote Sensing
1.1 Summary
This week, I am covering the basics of what remote sensing is and will focus on how remote sensing is based on the electromagnetic field. Other topics this week included scattering, interaction with the earth surface, data formats, and resolution.
Remote Sensing, also referred to as Earth Observation, is the process of collecting information about the earth’s surface from a distance. The information is obtained through aerial photography by airplanes or drones, or from satellite images. The foundation of Remote Sensing is electromagnetic radiation or more simply put, light reflected from objects. (Brady 2021)
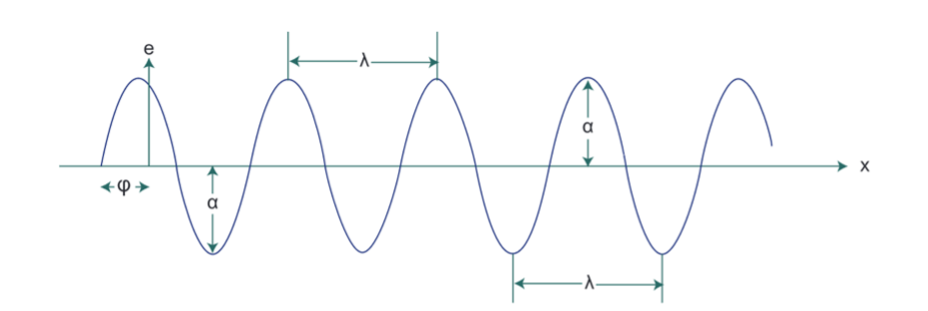
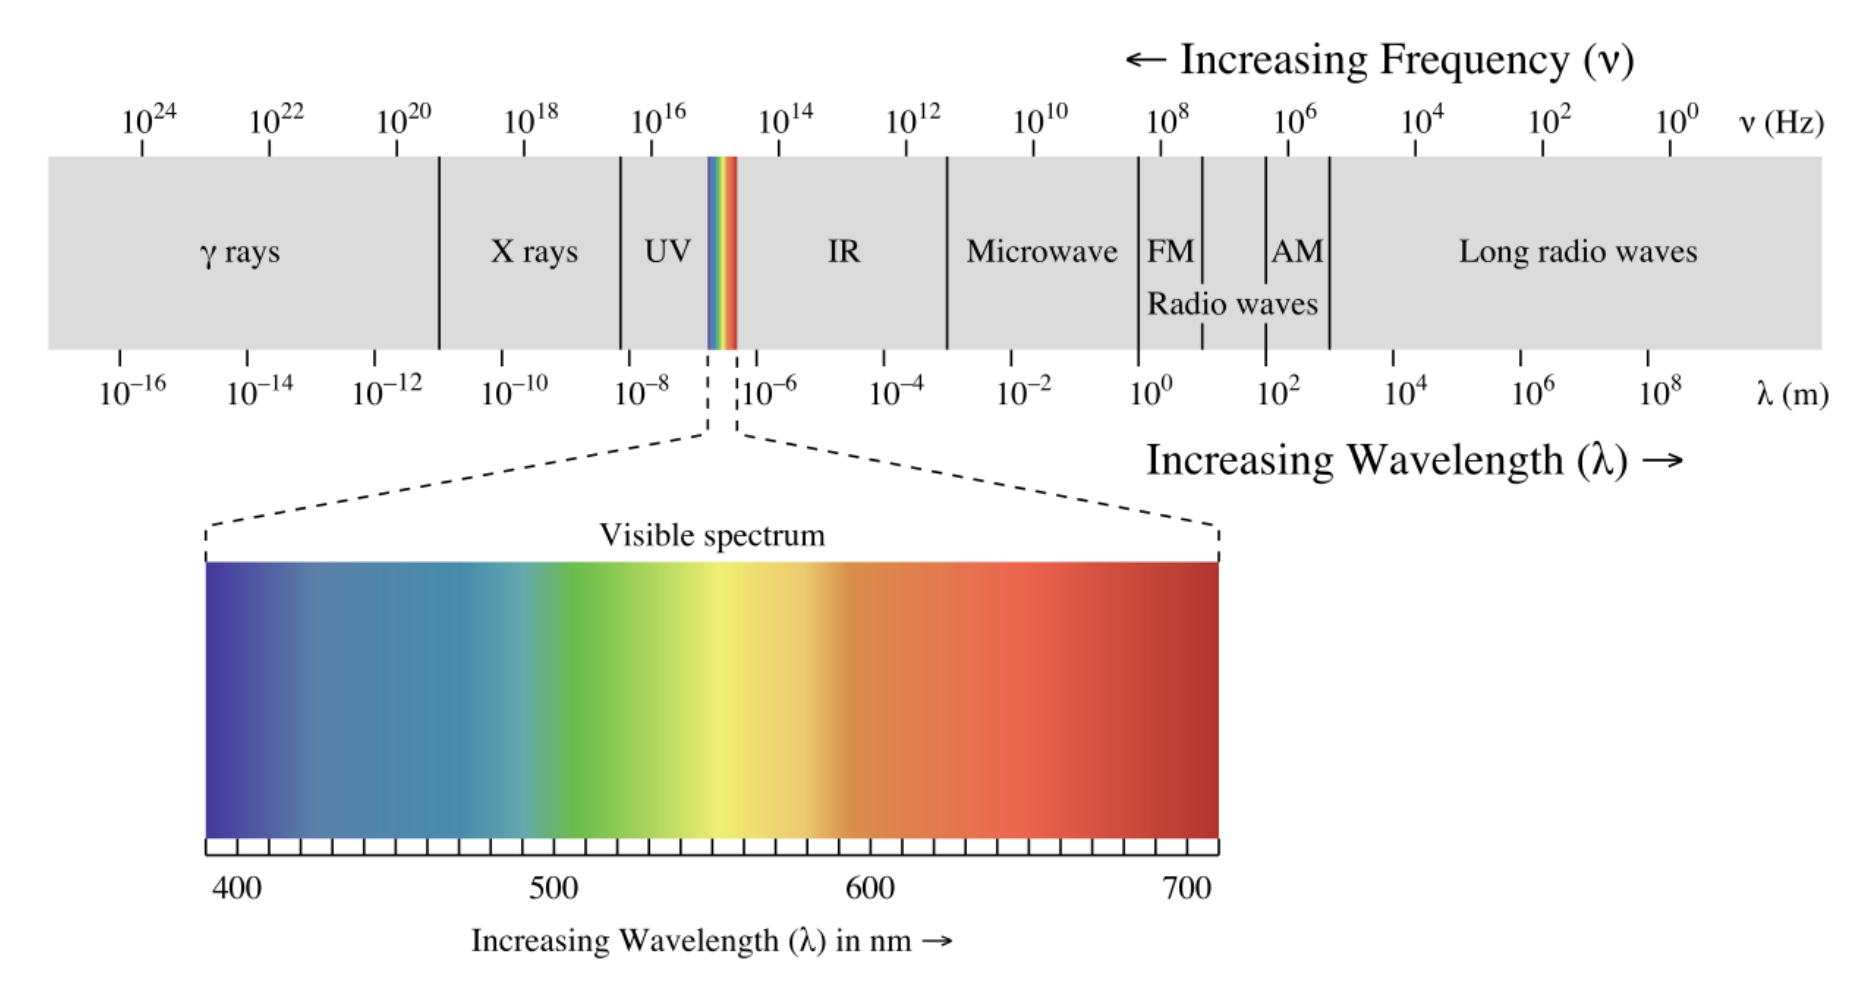
The Electro Magnetic Spectrum (EMS) has a huge range of energy waves, electric or magnetic, that vary in amplitude (α), length (λ), and frequency. Only a fraction of the spectrum is visible to the human eye. Those that are visible, we see as colors. All objects on the earth reflect electromagnetic waves in unique ways. For example, trees have a different electromagnetic signature than buildings or water bodies. (Brady 2021)
The images taken through remote sensing include wavelengths beyond those that are visible to the human eye. Therefore, analysis of this information allows us to see much more than what would be possible to see on e.g., a simple photography. Sections on the electric magnetic spectrum are captured in so called “bands”. The more bands, the higher the spectral resolution of the image.
Generally, there are two types of sensors – active and passive ones. Passive sensors use the sun as their energy source, while active sensors have their own energy source and therefore emit electromagnetic waves.
1.2 Application
As for many other technologies, remote sensing has its origin in the military and defense sector. It was first invented to gather information about the enemy in war, e.g. troop deployment or battle territory. (Brady 2021)
While still used in this context, today remote sensing has been adopted in a range of other disciplines including:
Climate science e.g., measuring changes in temperature over time,
Disaster Risk Reduction and Management, e.g., mapping flood risks,
Environmental science e.g., measuring water quality,
Geology e.g., measuring volcanic activity,
Urban Planning e.g., identifying informal settlements and monitoring urban growth,
Conflict studies e.g., measuring destruction in battle
Below I discuss the use of Sentinel data (from the European Space Agency) and Landsat data (from NASA) in the field of disaster risk reduction, more specifically flood risk management. Both Landsat and Sentinel data are open source data sets.
1.2.1 Mapping Floods with Landsat
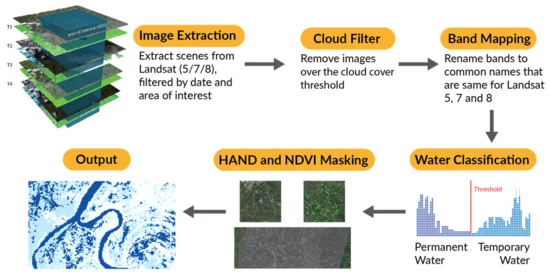
Figure 3 provides an overview of a typical work flow for a flood risk mapping using Landsat Data. I will understand these steps better over the next weeks. In short, Landsat 5, 7, and 8 images with low cloud cover are used to cover a longer period. A classifier that differentiates permanent water (river, sea, lakes etc.) from temporary water (flood) is applied. Vegetation (NDVI) and site specific other data (HAND) is masked (which means its cut out) to leave only a map of permanent and temporary water.
Mehmood, Conway, and Perera (2021) discuss that the accuracy of the classifier could be improved by training the same model on sentinel data. Sentinel data has a higher spatial resolution than Landsat (10m vs. 30m). Sentinel and Landsat have different revisit periods. Using both data sources can increase the frequency of images of the same point over time. A weakness of the study is that it does not consider socio-demographic data to understand flood vulnerability.
1.2.2 Mapping Floods with Sentinel
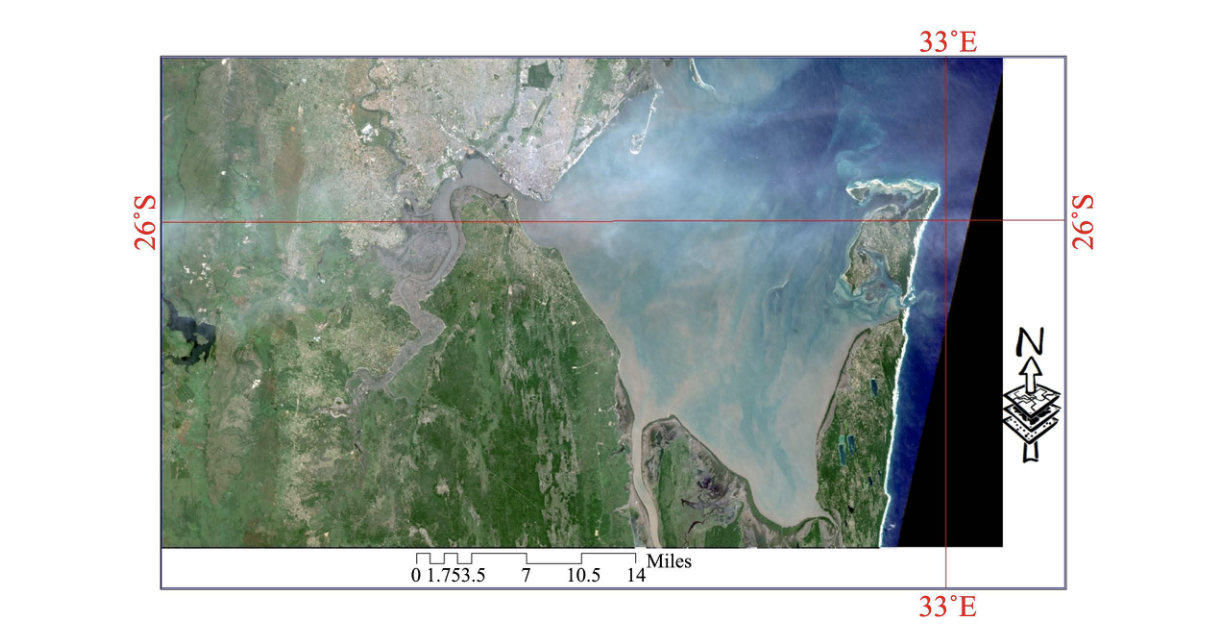
Twumasi et al. (2022), do just that! They mapped inundation caused by tropical cyclones in Maputo and Beira using Sentinel 2 data and combined they findings with demographic data to understand the impact of these floods on people.
Some of the image processing methods applied sound already somewhat familiar as we covered them in the lecture: “The images were geometrically corrected to remove, haze, scan lines and speckles, and then referenced to Mozambique ground-based Geographic: Lat/Lon coordinate system and WGS 84 Datum. Data from twelve spectral bands of Sentinel-2 satellite, covering the visible and near infrared sections of the electromagnetic spectrum, were further used in the analysis.” (Twumasi et al. 2022)
Something, that I noticed is that the study only takes into account the growing population for forecasting but not the effects of climate change on the likelihood and intensity of tropical cyclones in the future. Modeling climate change may be a useful to take this study forward and better understand future flood risk in Maputo and Beira.
1.3 Reflection
Next to learning about the electromagnetic field (something I hadn’t really thought about since 8th grade physics lessons) an issue that was interesting to me this week, was the range of different satellites available delivering imagery at different quality and cost.
In my work in the international development sector, we are often constraint to using publicly available data. This is due to tight project budgets but also because work done by external consultants should be reproducible by the beneficiary themselves, e.g. a local government. I wonder to what extend this presents a barrier for using remote sensing in the development and humanitarian sector. In fact, it seems that many of the free resources of satellite images provide good enough resolution for many planning and policy decisions. The International Monetary Fund for example, already considered remote sensing as a low cost option for data collection in comparison to airborne or ground surveys in 1992. (Bhatt 1992) Today, there is much more satellite images available and analysis has become easier, using applications like Google Earth Engine.
Even though remote sensing is a low cost option for data collection, it is not yet applied at scale in my field of work (urban planning & international development). According to a recent paper on the potential of remote sensing for the urban development sector, this may be due to limited capabilities in local governments and reluctance to change existing data collection and management systems. (Prakash et al. 2020) From my experience, this is a valid point. Data literacy in many local governments in LMIC is not high. Applying these new technologies is great, but they also need to be accessible to those that take decisions locally. Capacity building is therefore key.