8 Syntactic Aperture Radar
8.1 Summary
In this lecture, we cover Syntactic Aperture Radar (SAR). Below I explain what it is and what kind of analysis it can be used for?
In remote sensing there are passive and active sensors, where the former uses the sun as source of light and the latter provides their own illumination. We saw this in week 1. SAR is an active sensor. It works a bit like a bat. It sends out a radar signal. The signal meets an object and bounces back. The sensor “listens” to the reflected signal. The nature of the returning signal tells us information about the earth surface, about the object it bounced back from. Hence, SAR is generating information about the earth typology. The sea for example is a flat surface and, therefore, reflects the radar signal into space rather than towards the sensor. The sea therefore usually looks very dark on a radar image. SAR images can be used to detect floods (flat surface). Sentinel 1 is an example of SAR.
Unlike optical sensors, which measure a wide range of electromagnetic waves across the spectrium using different bands, SAR sends out only very specific wavelengths (a narrow fraction of the electro magentic spectrum). In SAR sensors, different wavelengths are chosen to measure different things. The most common wavelength are C-Band radio magnetic waves.
SAR sensors are off nadir and they are moving. The fact that a SAR sensor is in motion effects the way in which it receives waves. In a normal camera, aperture refers to size of the opening through which we let light in. A high aperture means more light in the camera achieving higher resolution. In SAR, this is governed by the antenna. For high resolution we would need a really long antenna. We can simulate a long antenna and achieve high resolution by taking images of the same point multiple times and thereby increase resolution.
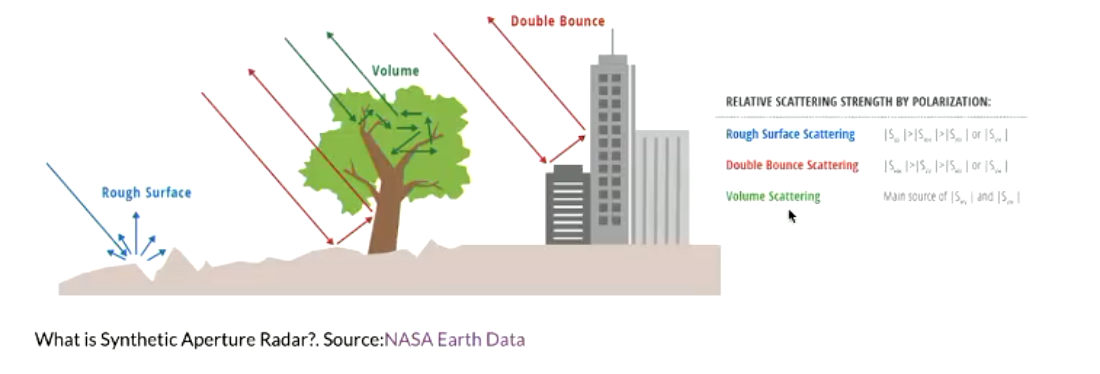
SAR polarization refers to the SAR sensor being able to transmit and receive electro-magnetic signal horizontally and vertically. Different earth surfaces reflect differently in terms of vertical and horizontal waves. The image below shows how different objects reflect differently.
Interferometry is a SAR technique that combines multiple SAR images over the same region at different times to detect change in the earth surface. This is for example, very useful to detect movement on the ground surface for earth quake risk detection. However, sadly this is not stored in GEE.
In GEE different types of SAR data is available. Sentinel 1 is the most commonly used. Power Scale is the raw data. DB scale (decibel scale) is the multiplying 10 times the Log10 value of the power scale value. DB scale is better for visualization but needs to be treated differently in statistical analysis.
8.2 Application
SAR is very useful for change detection. One of the application areas is therefore damage assessment - in conflict but also natural disaster.
Ollie (Ballinger) is working on an approach for using SAR data for identifying buildings that have been damaged in conflict due to fighting. The current state of the art to do this is using High Resolution Images and Neural Networks – as I discussed last week. However, as discussed during the lecture, there are a few problems with this approach. For once, it’s computationally and financially expensive. Another problem is that optical images are not always available, e.g. when there are clouds. Neural Networks don’t generalize very well. Trained in one area, they don’t work as well in a different geography.
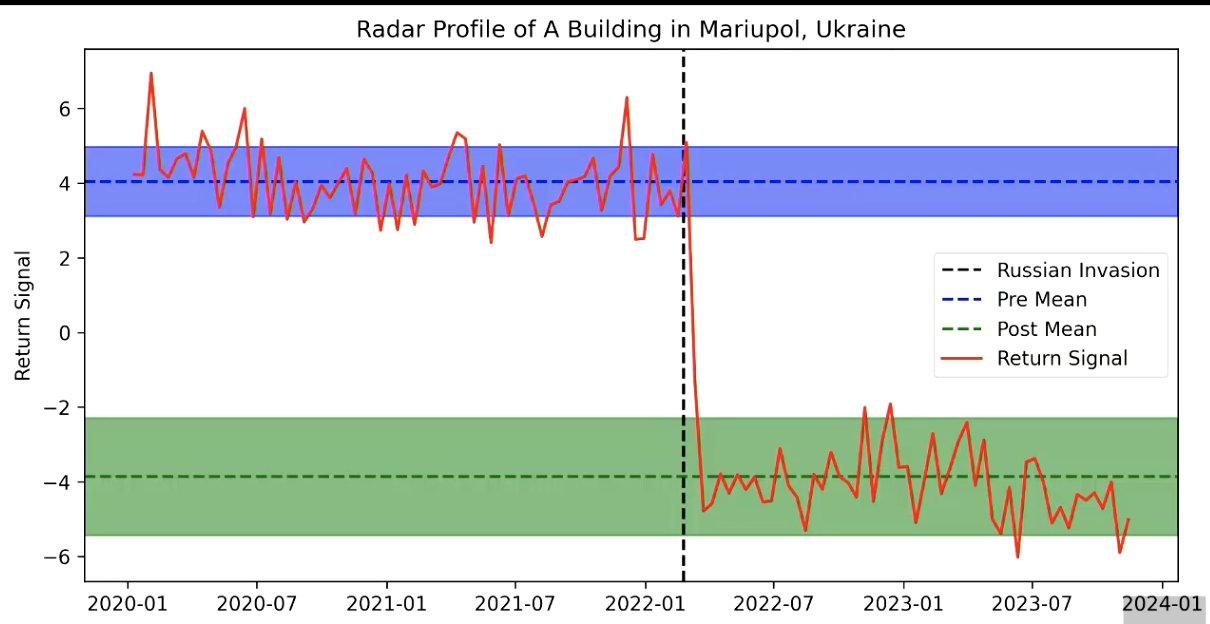
So the method that Ollie is working on, and presented in the lecture, uses pre- and post-disater images and applies a simple t-test to calculate the ratio in change in amplitude to general pixel variance. Damage to a buildings leads to a change in backscatter amplitude from the pre to post disaster image. In order to differentiate between a building damage and normal changes the results need to be compared with the building footprint. There is always a little bit of variation, e.g. because of rain or snow. In the image below you can see the difference between double bounce scattering (building) and rough surface scattering (rubble). The variation within pre and post scattering is fairly low, because both the pre and post war structure is static.
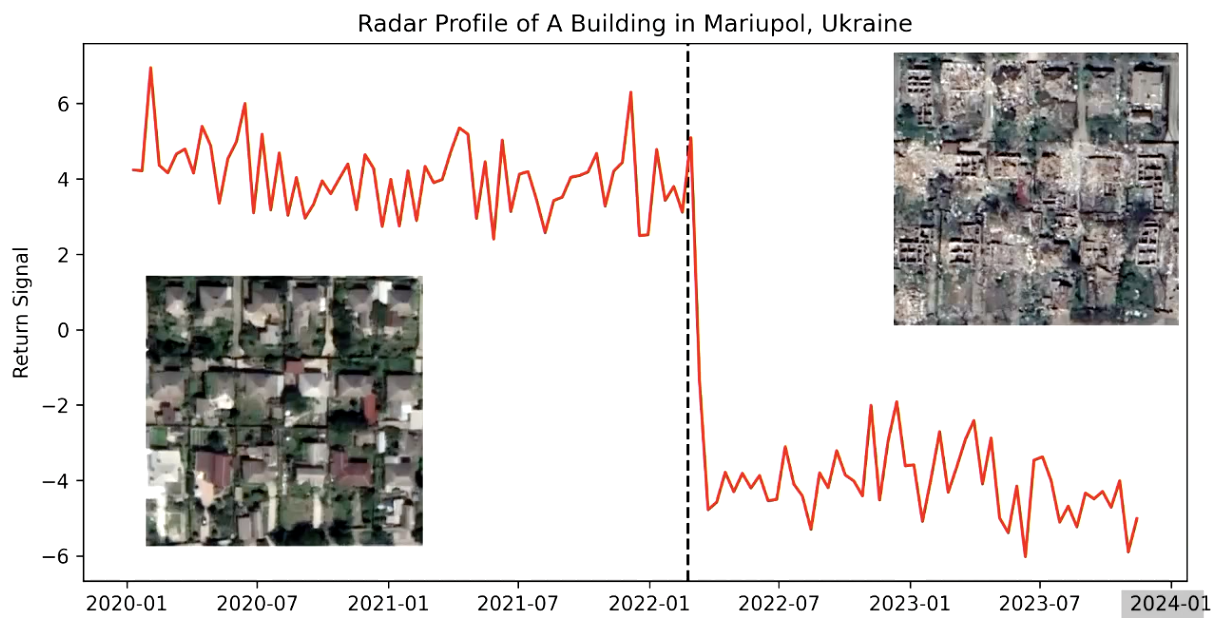
So essentially, we check if there is a significant difference between the means of the pre disaster and post disaster pixels. So for this to work you need a clear pre and post image. That is not always the case. In some instances, for example in Gaza, there is continuous or repeated destruction. In other instances, not SAR data may be available pre disaster.
Ge, Gokon, and Meguro (2020) explain that building damage assessments can also be done based only on post disaster SAR images using texture-based approaches in combination with machine learning classifiers, such as random forest. This method has been used for mapping damage after the 2015 Nepal earth quake. I wonder if such approaches are still being used today, where pre and post disaster SAR data should be publicly available from Sentinel 1, which has a revisit time of 12 days.
8.3 Reflection
Across this week and week 6, we’ve looked at different approaches for detecting building damage. What stands out to me is that neither of them are applied at scale in practice. In fact, the UN conducts damage assessment manually.
UNOSAT is the UN Satellite Centre. They conduct damage assessment for conflicts around the world. Their methodology is described as: “Analysts closely review satellite imagery, often comparing two or more images together, and determine notable changes between the images. For damage assessments, refugee or IDP assessments, and similar analyses, these changes are then manually documented in the vector data by the analyst.” (“UNOSAT North Gaza Governorate Damage Assessment Analysis - 15 October 2023 - Humanitarian Data Exchange” n.d.) This must be a really labor, cost and time intensive process.
For me, it is really interesting to see the gap between research and practice when it comes to remote sensing. I wonder what is needed to bridge this gaps and make remote sensing really work for the development and humanitarian sector. I personally feel like one reason may be that the system of academia and the system of let’s say the UN function completely differently. The mechanics of how these systems operate, the structures people work in, the languages they use and the goals they work towards are different. This makes makes communication between systems unlikely. This brings me back to Niklas Luhmann and his system’s theory, which haunted me my whole undergrad studies in social theory.